Student Achievement
Student Achievement
1.1 Graduation Rates
Graduation rate cohort includes all full-time, first-time degree/certificate-seeking undergraduate students. First-time degree/certificate-seeking undergraduates with 150% of normal time to program completion.
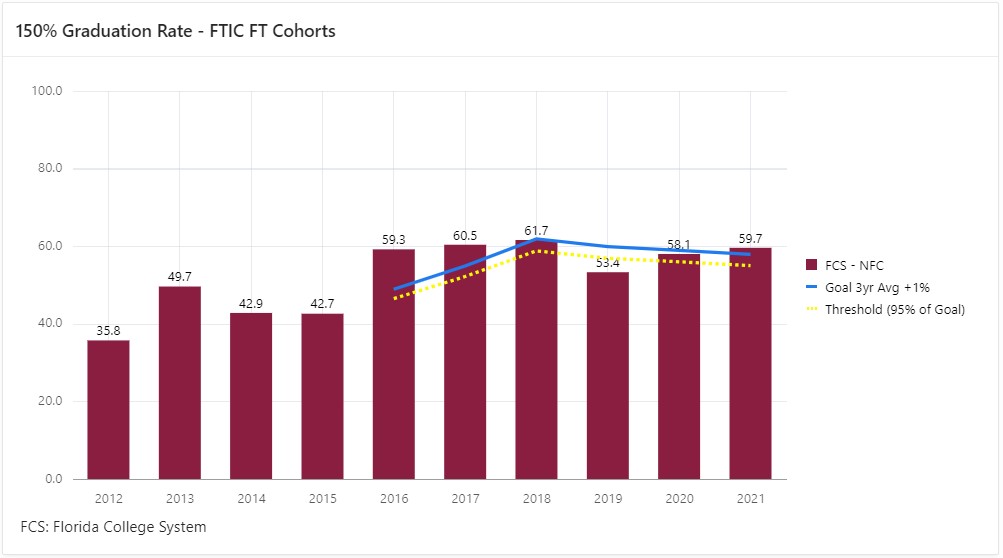
*Goals are set at one percentage point above the 3 year average. Minimum thresholds are set at 95% of goal.
1.2 Graduation Rates by Ethnicity

*Goals are set at one percentage point above the 3 year average. Minimum thresholds are set at 95% of goal.
2.1 Retention Rates

*Goals are set at one percentage point above the 3 year average. Minimum thresholds are set at 95% of goal.
2.2 Retention Rates by Ethnicity

|
Fall to Fall - Retention Rate by Ethnicity |
||||||||
|
Ethnicity |
Fall 2012 |
Fall 2013 |
Fall 2014 |
Fall 2015 |
Fall 2016 |
Fall 2017 |
Fall 2018 |
Fall 2019 |
|
White |
66.0% |
81.7% |
70.1% |
67.4% |
69.0% |
76.6% |
74.8% |
70.8% |
|
Black |
57.8% |
61.5% |
54.9% |
69.0% |
68.1% |
64.4% |
67.3% |
51.1% |
|
Hispanic |
62.5% |
85.0% |
62.5% |
91.7% |
47.6% |
80.0% |
73.3% |
65.0% |
Source:
NFC Institutional Research Department
*cohort = FTIC Full-Time and FTIC Part-Time
*fall to fall retention = [number of cohort students still enrolled next fall] divided
by [number of cohort students in the cohort – number who graduated before next fall]
3.1 Program Completers Earning Applicable Industry Certification
|
Completers Earning Certifications by Academic Year |
||||||
|
Program |
2015 |
2016 |
2017 |
2018 |
2019 |
2020 |
|
2009-AS-Registered Nursing |
100% |
93% |
100% |
94% |
96% |
93% |
|
2019-AS-LPN to RN Bridge |
82% |
100% |
100% |
92% |
95% |
78% |
|
4002-Paramedic |
95% |
67% |
100% |
75% |
50% |
|
|
5002-Practical Nursing |
95% |
100% |
89% |
100% |
86% |
50% |
|
5007-Patient Care Technician |
|
100% |
56% |
|
|
|
|
5041-Pharmacy Technician |
92% |
100% |
|
|
|
|
|
5036-Correctional Officer (BRTP) |
60% |
96% |
94% |
63% |
|
|
|
5028-CMS Law Enforcement |
50% |
|
|
|
|
|
|
5042-Fla Law Enforcement Academy |
100% |
64% |
80% |
67% |
100% |
58% |
|
5049-Medical Coder/Biller |
|
|
|
23% |
0% |
0% |
|
4031-Medical Coder/Biller |
|
|
|
|
|
0% |
|
5034-Medical Admin Specialist |
90% |
82% |
100% |
|
|
|
|
5050-Medical Assisting |
|
|
|
80% |
|
|
|
5046-Automation & Production Tech |
83% |
92% |
78% |
100% |
|
|
|
5052-Adv Manufacturing/Prod Tech |
|
|
|
|
60% |
29% |
|
6001-ATD-Emergency Med Tech-Basic |
47% |
52% |
67% |
56% |
|
|
|
4030-Emergency Medical Technician |
|
|
|
|
47% |
63% |
3.2 Licensure Pass Rates by Ethnicity
|
Completers Earning Certifications by Academic Year and Ethnicity |
||||||
|
Ethnicity |
2015 |
2016 |
2017 |
2018 |
2019 |
2020 |
|
Asian |
100% |
|
100% |
100% |
|
|
|
Black |
69% |
85% |
86% |
69% |
62% |
38% |
|
Hispanic |
80% |
57% |
75% |
78% |
86% |
67% |
|
American Indian |
100% |
0% |
||||
|
Multiple |
0% |
0% |
0% |
0% |
100% |
100% |
|
White |
83% |
81% |
88% |
82% |
81% |
69% |
|
Unknown |
|
|
|
|
|
0% |
|
Total |
80% |
81% |
87% |
77% |
77% |
62% |
4.1 Transfer Rates (AA graduates to any other institution)
|
AA Graduates Transfer Summary to FL or GA Institutions |
||||||||||||||||
|
Academic Year |
2016 |
2017 |
2018 |
2019 |
2020 |
|||||||||||
|
Time to Transfer |
<1yr |
>1yr |
None |
<1yr |
>1yr |
None |
<1yr |
>1yr |
None |
<1yr |
>1yr |
None |
<1yr |
>1yr |
None |
|
|
FL |
61 |
15 |
0 |
60 |
26 |
0 |
66 |
20 |
0 |
78 |
9 |
0 |
51 |
7 |
0 |
|
|
GA |
9 |
4 |
0 |
10 |
5 |
0 |
13 |
2 |
0 |
20 |
3 |
0 |
18 |
1 |
0 |
|
|
Other States |
1 |
1 |
0 |
3 |
4 |
0 |
2 |
0 |
0 |
2 |
2 |
0 |
4 |
0 |
0 |
|
|
Total |
71 |
20 |
67 |
73 |
35 |
49 |
81 |
22 |
65 |
100 |
14 |
62 |
73 |
8 |
102 |
|
|
Transfer Rate < 1yr |
45.2% |
|
|
46.5% |
|
|
48.2% |
|
|
56.5% |
|
|
40.3% |
|
|
|
|
Transfer Rate - All |
58.0% |
|
68.8% |
|
61.3% |
|
64.4% |
|
44.8% |
|
||||||
|
Total # AA Graduates |
157 |
157 |
168 |
177 |
181 |
|||||||||||
*Time to transfer is defined from AA graduation date to first date of enrollment at new institution.
4.2 Transfer Rates by Ethnicity

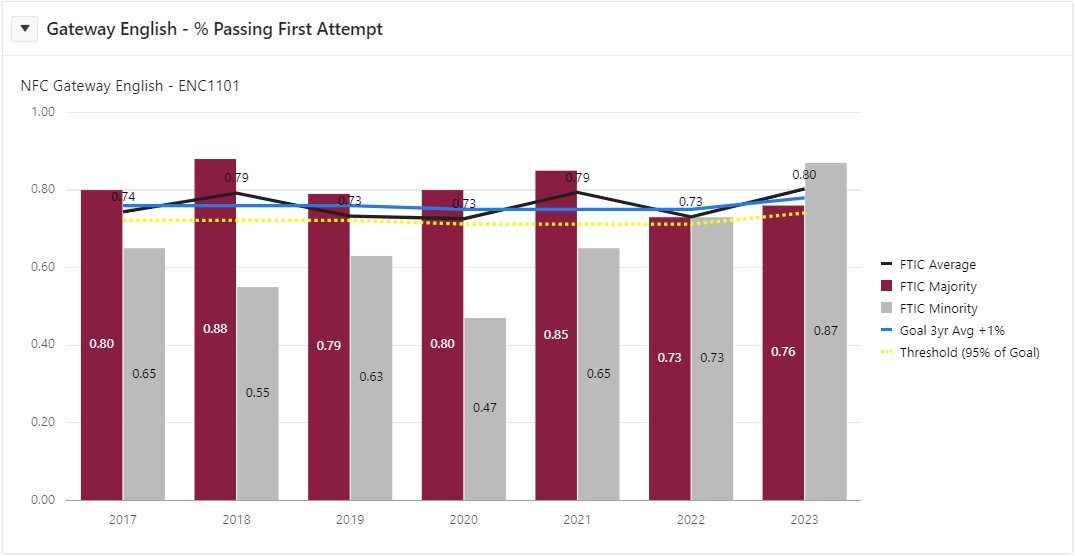
5.1 Gateway English Pass Rates
5.2 Gateway Math Pass Rates
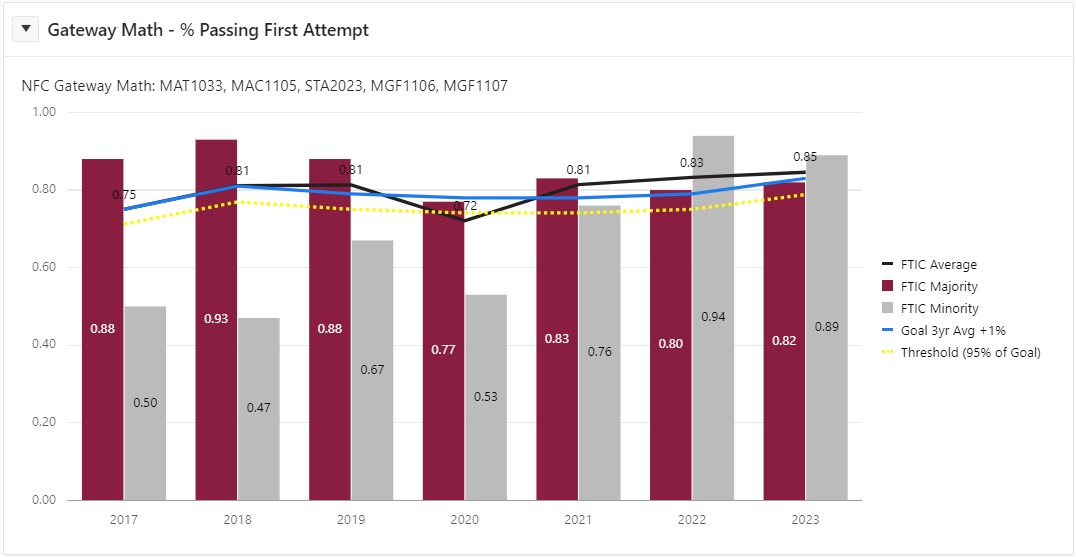
*Goals are set at one percentage point above the 3 year average. Minimum thresholds are set at 95% of goal.
Contact NFC
|
Office of Institutional Research & Effectiveness |